PAE's Greenhouse Gas Emissions Analysis Calculator
The time has come for our industry to make the next leap in measuring a building’s impact on the environment.
Currently, the most widely accepted metric in North America is the concept of site “EUI” (energy use intensity). When we look at energy usage of a building, the EUI provides information on how efficiently the building is performing. A low EUI implies the building is performing well so it is assumed that this equates to a low environmental impact. We’d like to argue, this is not necessarily the case. The disconnect between building energy use and environmental impact all comes down to the actual greenhouse gas emissions from operating a building.
As the name implies, greenhouse gas emissions measure the pounds of environmentally disruptive gases released in to the atmosphere. The gases considered to fall in this category are comprised of Carbon Dioxide (CO2), Methane (CH4), Nitrous Oxide (N2O) and fluorinated gases (HFC, PFC, SF6, etc.). These can come from a multitude of sources, including electricity generation sources that provide power to the electric grid. It is not the electrons being delivered to the building that causes environmental damage being addressed with energy efficient design, it is the gases released in the production of those electrons. Therefore the core of the issue is not how much energy the building uses, but rather how much greenhouse gas (GHG) it is responsible for emitting due to the energy it uses.
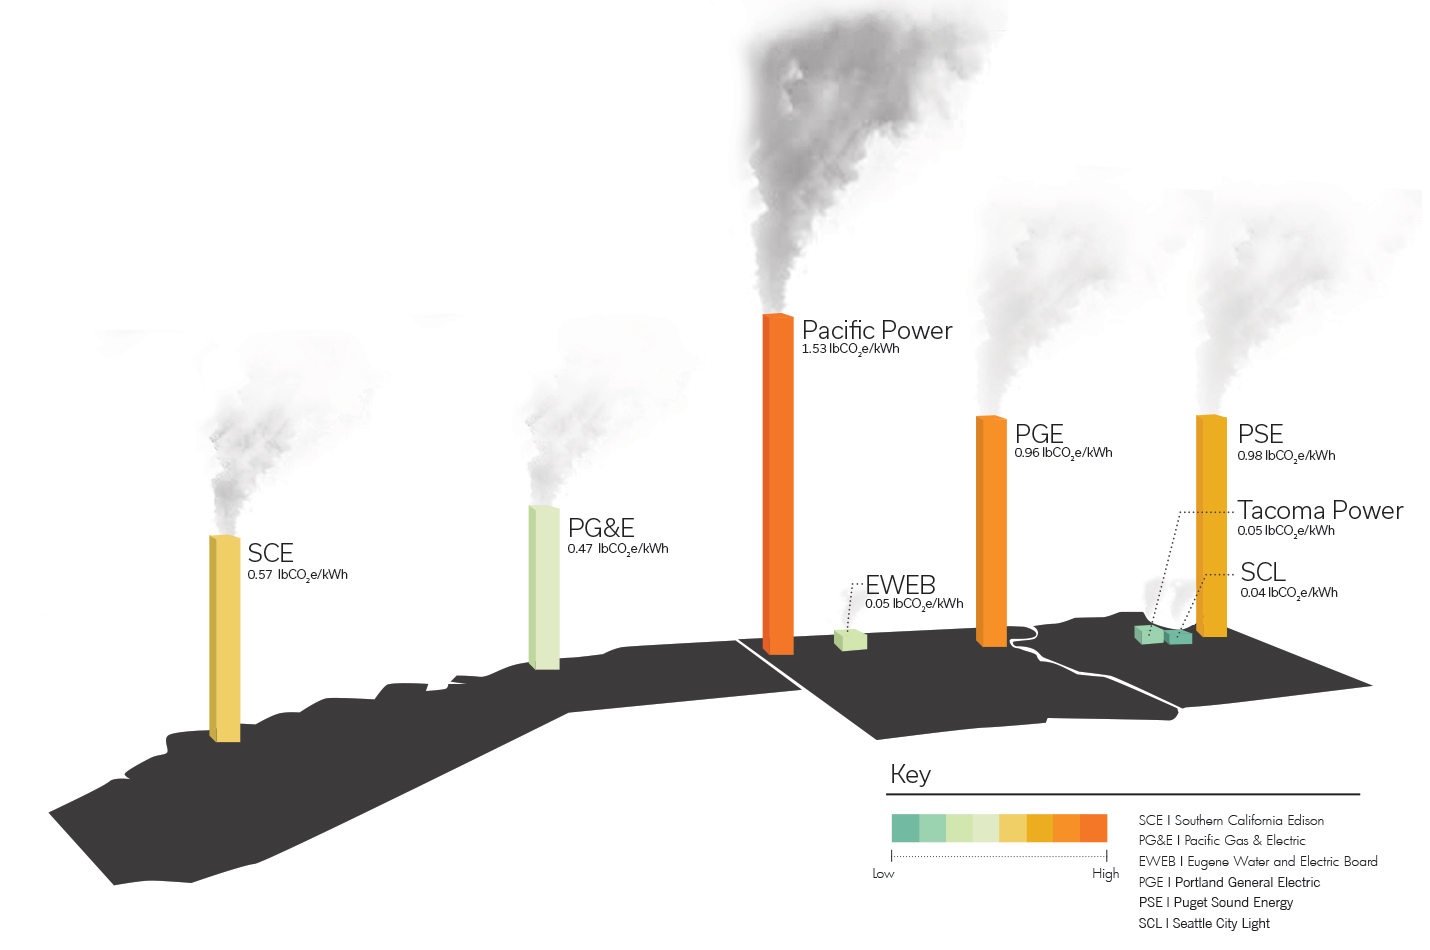
Surprisingly, the impact of a project’s greenhouse gas emissions comes down to where it is located. If your building is connected to a grid that pulls from generation sources with high GHG emissions such as coal or petroleum, then even a low energy building can still have a high GHG emissions impact. The reverse is also true - the GHG impact of a building connected to a grid with low emissions can be lower than a comparable building with a high emissions grid, even with a higher EUI. For example, Seattle City Light in Washington has an emissions rate of 0.04 lbCO2e/kWh. On the other end of the scale, Pacific Power in Oregon is at 1.73 lbCO2e/kWh (See Figure 1). Let’s place an identical 30 EUI, 40,000 square-foot building in each of these territories. The Seattle City Light building would contribute an annual GHG emission of 14,000 lbCO2e, whereas the identical Pacific Power building would contribute a staggering 612,000 lbCO2e on an annual basis.
So where does this leave us? It means our next leap in sustainable design is to incorporate not just energy usage but also GHG emissions into the discussion of sustainable buildings. One of the 2016 PAE R&D Grant projects is looking to do just that.
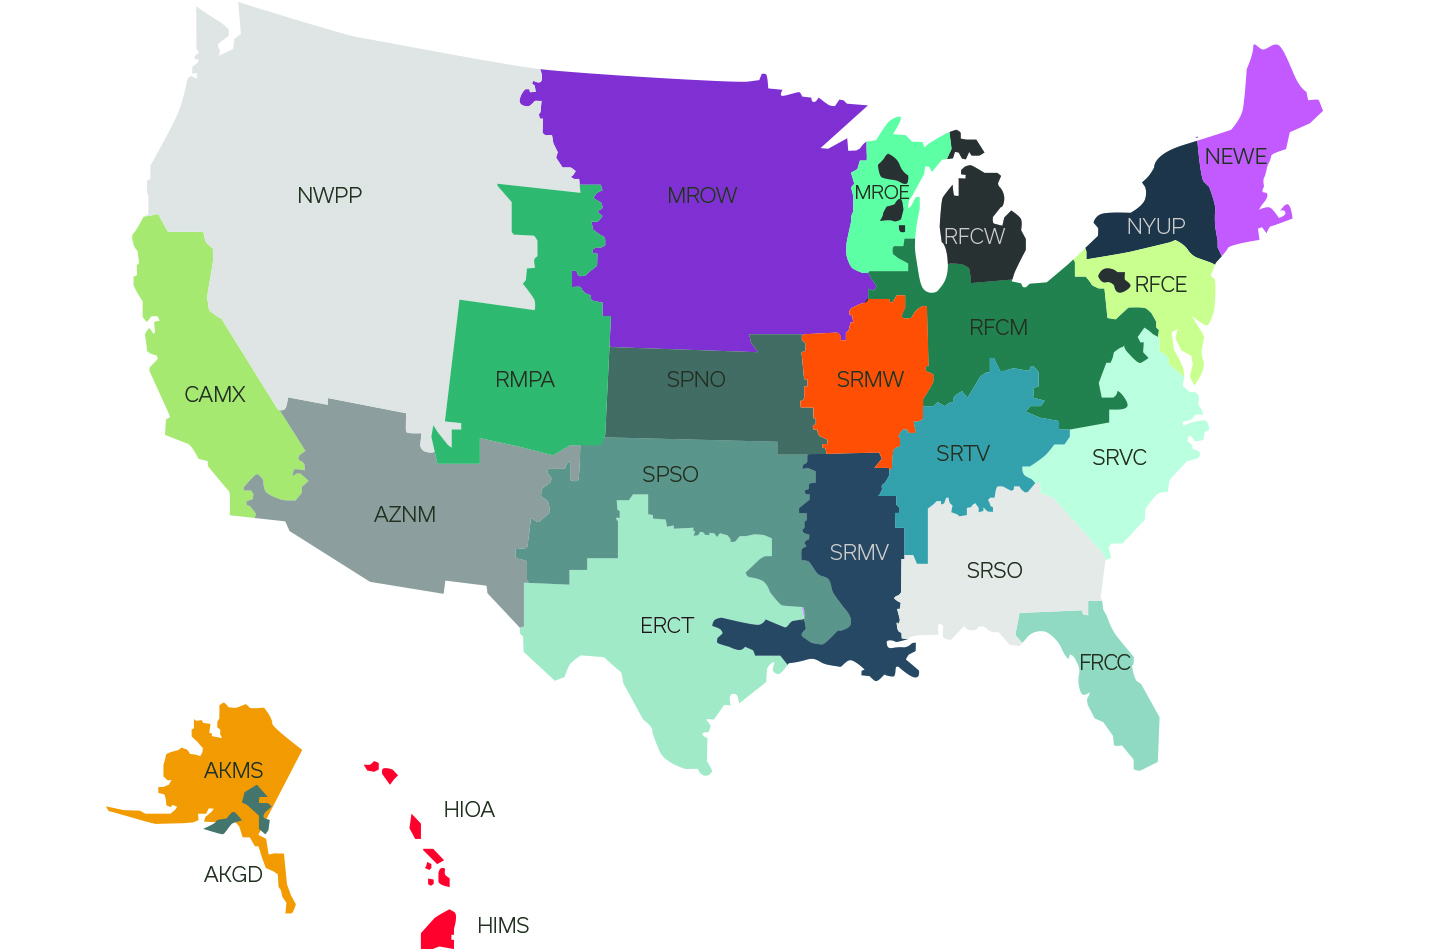
In 2016 PAE announced an internal “grant” program that now funds several in-house research projects. One of the projects is an effort to develop a new tool to more accurately calculate GHG emissions. Although there are currently tools available for calculating greenhouse gas emissions based on location, they use extremely large geographical regions comprised of multiple states with utility emissions averaged over the entire area. (See Figure 2)
As demonstrated in our example building, less than 200 miles of distance can result in vastly different emissions so granularity is key with these calculations. The PAE research team decided to instead develop a tool that would allow the user to evaluate a building’s emissions based on the specific utility it was connecting to - and the PAE Greenhouse Gas Emissions Analysis (GGEA) Calculator was born.
The goal of the GGEA Calculator is to give designers a tool to quickly evaluate the greenhouse gas emissions of their project based on zip code. This information can help inform the real impact of onsite renewables. Photovoltaics and other renewable energy sources are more environmentally critical in areas with high emission rates, something an owner might not see if utility bills are the only consideration. Emissions data can also help determine how important a couple extra EUI points is to the impact of the building.
This knowledge can also play a role in informing utility customers of exactly what they are buying. California has started sharing a “Power Content Label”, essentially a nutrition label for utility customers. Customers might start asking for electrons with less saturated fat if they knew how much they were receiving. The hope is that the PAE GGEA Calculator will help bring all this information to the table during project design so our design teams can make strategic decisions regarding the full environmental impact of their design. In the end, we’ll be one more step farther on the path towards sustainable design.